


Executive Accounts Receivable dashboard
Automated AR reporting with public data. Executive dashboard to monitor aging, overdue ratio, total at risk and critical client ranking. Scheduled refresh several times a day so finance can anticipate risks and act fast.
- Aging by client and segment
- Early-risk alerts
- Executive reports always up to date
Executive dashboard demo

Loading interactive dashboard…It activates when you reach this section.


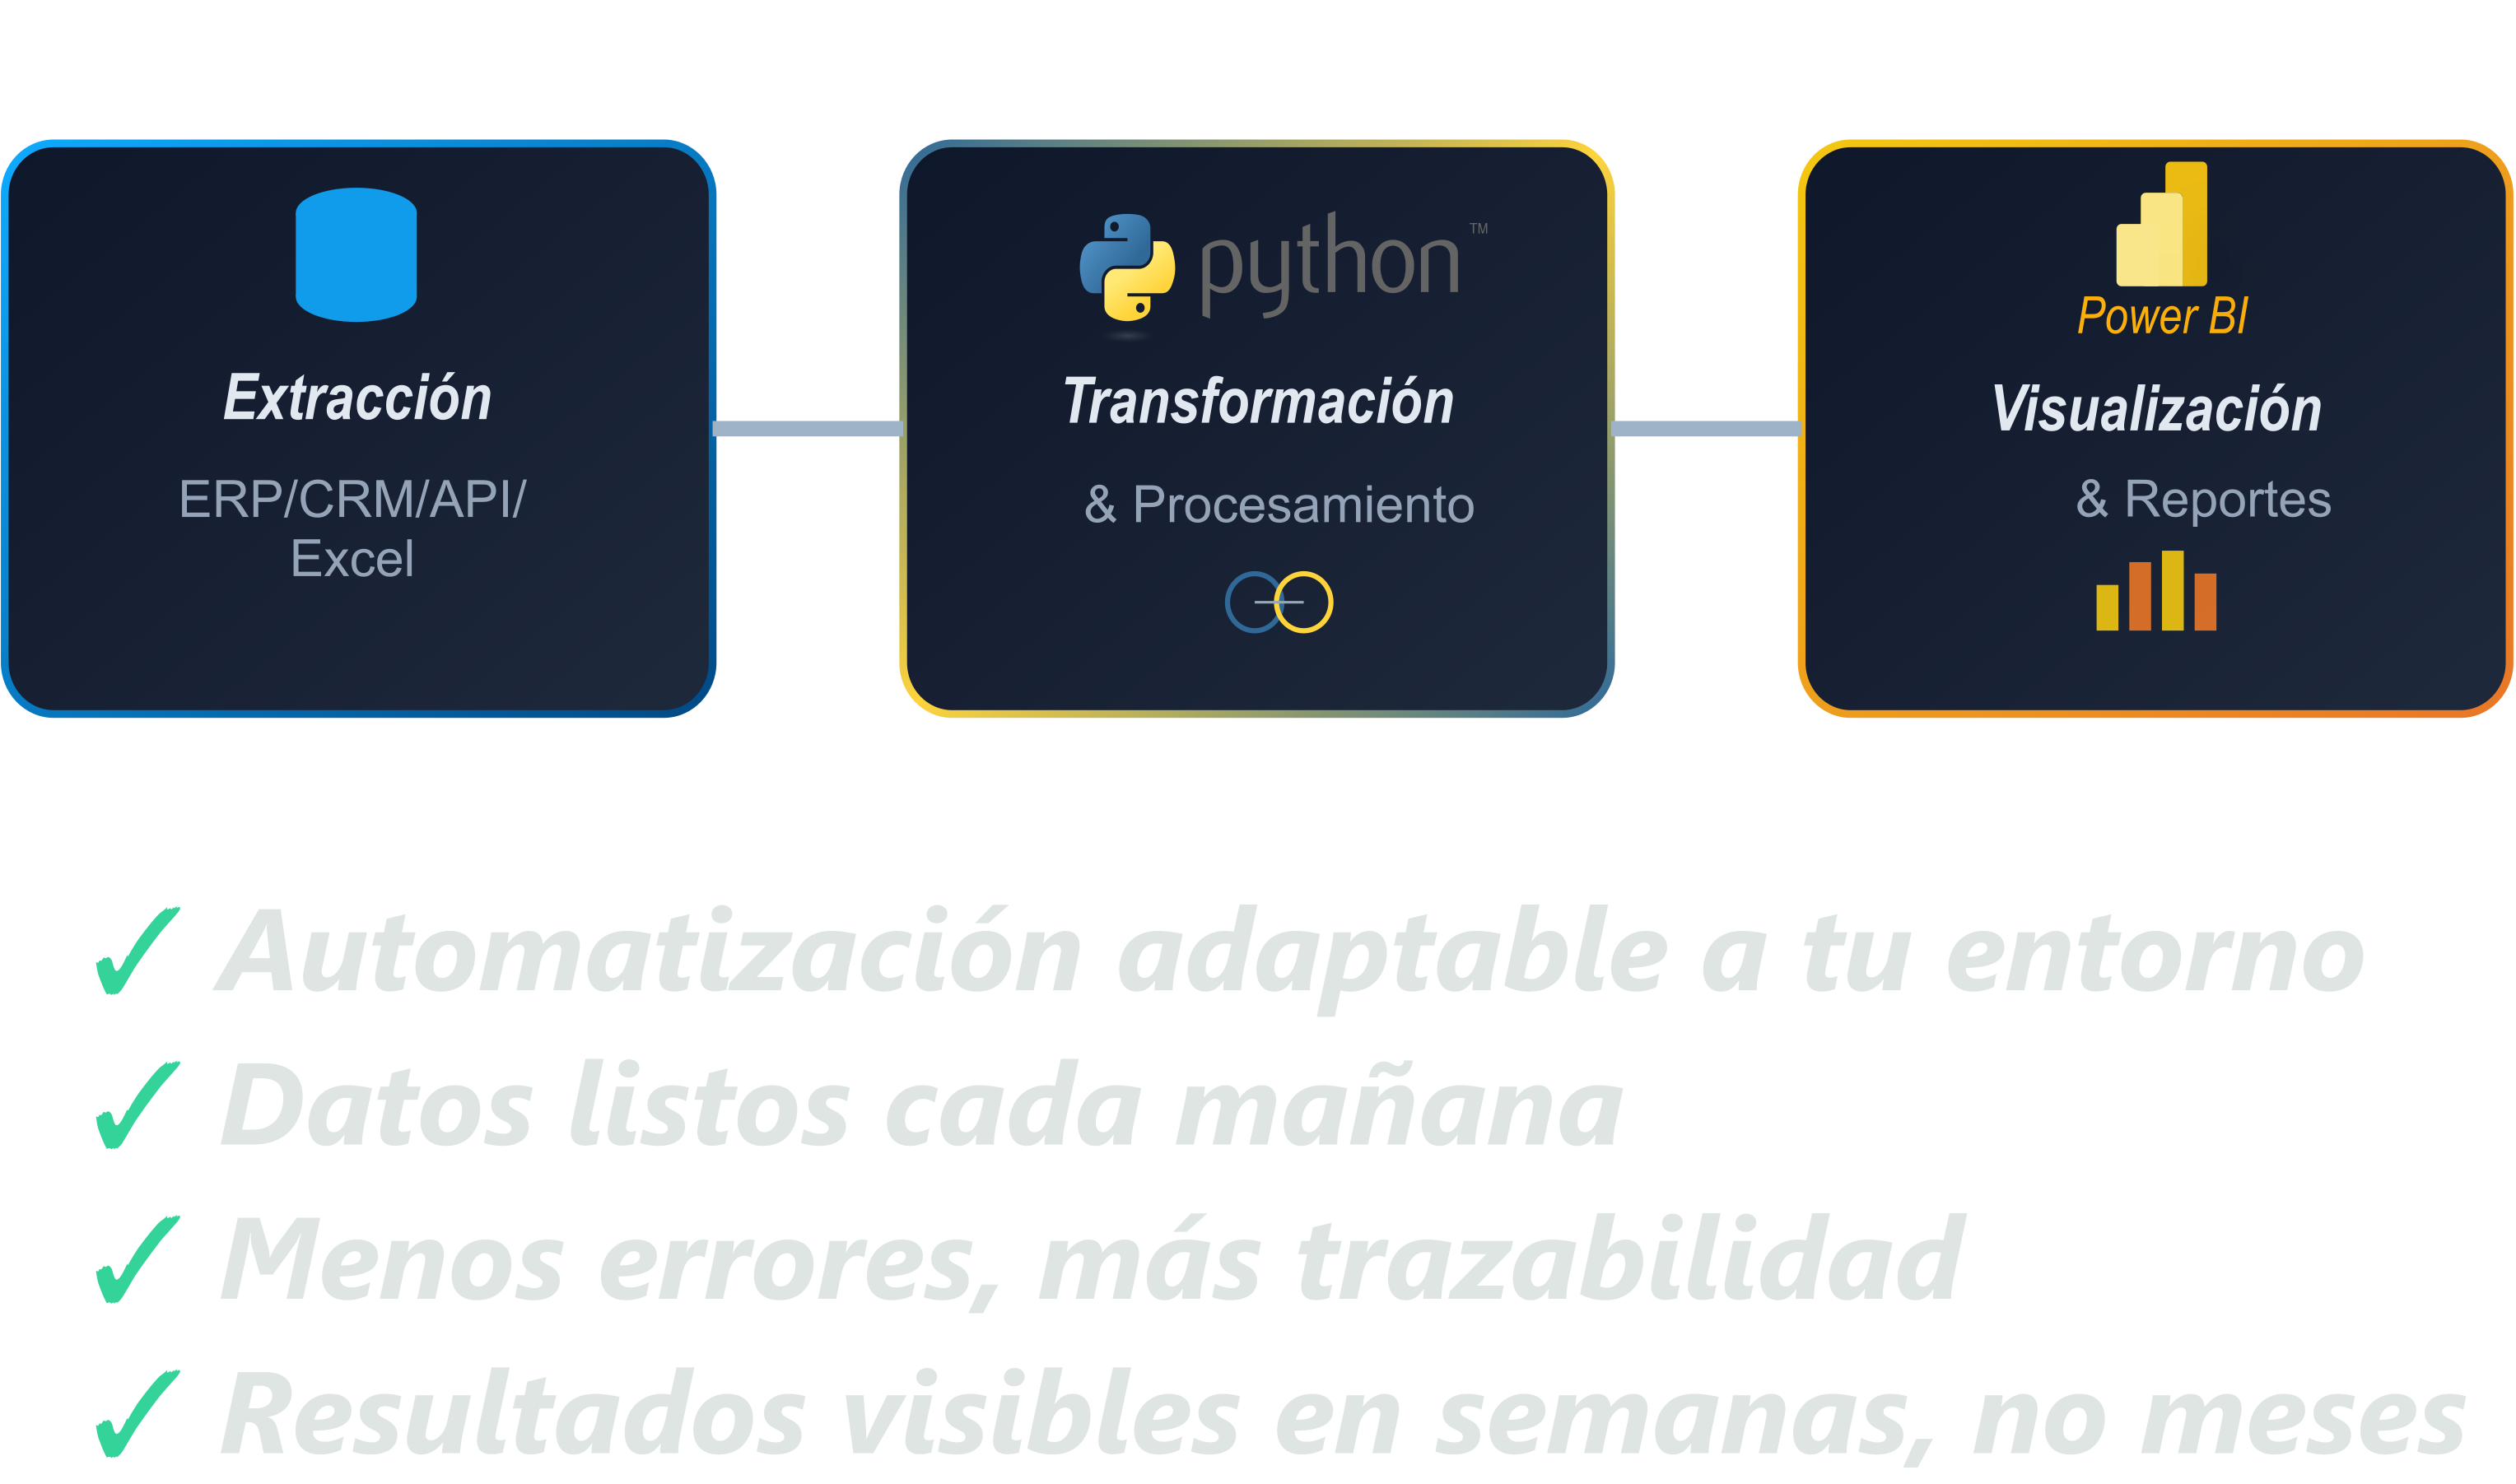
 Tito Pipeline